Key performance indicators (KPIs)
We use a range of performance indicators, both financial and non-financial, to measure both the delivery of the Company's strategic objectives and to manage the business. The most important of these measures are considered KPIs and their targets are determined annually during the business planning process. The KPIs are used by management to compare actual performance during the year, and the latest monthly forecasts, against the annual budgeted targets. Our KPIs, both financial and non-financial, are set out below.
| Financial KPIs | Non-financial KPIs |
|---|---|
| Our financial key performance indicators address two key aspects of the business, its profitability and its cash generation: | Our non-financial key performance indicators address other aspects of the business: safety, environmental and operational performance: |
| Profit from operations (PFO)* | Accident frequency rate (AFR) |
| Earnings per share (EPS)* | Reportable environmental incidents |
| Free cash flow | Technical availability |
* Financial KPIs are presented excluding exceptional items and specific IAS 39 mark to market movements
The explanations of our KPIs are as follows:
Profit from operations (PFO)
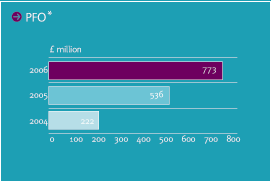
PFO is a measure of the operating profitability of the Group. It excludes the impact of all non-operating costs from subsidiaries, including financing costs and income tax expense, and therefore provides a comprehensive measure of operational and financial performance. We consider PFO excluding exceptional items and specific IAS 39 mark to market movements to be an appropriate indicator of performance, as this measure: excludes significant items which, by virtue of their size or incidence, could potentially distort year-on-year comparisons; allows a better understanding of the financial information presented, and specifically the Group's underlying business performance by excluding fair value movements on economic hedges; and assists shareholders and analysts who have expressed a preference for the reporting of results without the inclusion of the effects of exceptional items and specific IAS 39 mark to market movements. Presenting the Group's segment and total PFO excluding exceptional items and specific IAS 39 mark to market movements is consistent with the way management measures the Group's performance in its budgets, forecasts and management accounts on a day-to-day basis. PFO excluding exceptional items and specific IAS 39 mark to market movements is presented in the consolidated income statement. The results of this KPI for 2005 and 2006 and the objective for 2007 are set out below.
Earnings per share (EPS)
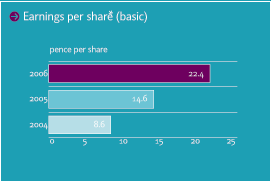
EPS is a measure of the overall profitability of the Group and shareholder returns. It is defined as the profit in pence attributable to each Ordinary Share in the Company, based on the consolidated profit for the year, after deducting tax, minority interests, and when applicable, preference share dividends. The calculation is shown in note 11 to the financial statements. Growth in EPS over time is indicative of the ability of the Group to add value. We consider EPS excluding exceptional items and specific IAS 39 mark to market movements as an appropriate indicator of performance as it: excludes significant items which, by virtue of their size or incidence, could potentially distort the year-on-year comparison; allows a better understanding of the financial information presented, and specifically the Group's underlying business performance by excluding fair value movements on economic hedges; and assists shareholders and analysts who have expressed a preference for the reporting of results without the inclusion of the effects of exceptional items and specific IAS 39 mark to market movements. This is consistent with the way management measures the Group's performance in its budgets, forecasts and management accounts on a day-to-day basis. The results of this KPI for 2005 and 2006 and the objective for 2007 are set out below.
In 2005 we reported this KPI as EPS before exceptional items. We have changed the basis of measurement in 2006 to reflect how we now measure underlying business performance before both exceptional items and specific IAS 39 mark to market movements.
Free cash flow
Power generation is a capital intensive business and hence it requires the assets within the Group to generate sufficient cash to repay the initial investment in the assets, to provide returns for shareholders and to provide funds for future investment opportunities. We define free cash flow as net cash flow from operating activities excluding exceptional cash flows associated with items recorded as exceptional in the income statement, and capital expenditure for growth projects (which enhances the economic benefits of the Group). Free cash flow includes capital expenditure to maintain the operating capability of the Group (by replacing or restoring individual assets or components), interest, and tax.
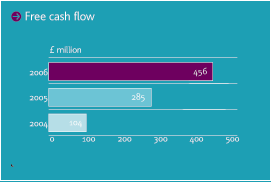
We consider this measure of cash flow to be a key indicator of business performance as it measures the cash generated from underlying business performance from continuing operating activities. This is consistent with the way management measures the Group's performance in its budgets, forecasts and management accounts on a day-to-day basis. The derivation of free cash flow and the results of this KPI for 2005 and 2006 are set out below.
Accident frequency rate (AFR)
Health and safety is of vital importance in our business. Not only is it important to provide employees with a safe place to work, any accident is disruptive to the running of the business. AFR is the normal reporting standard and is defined as the number of lost time accidents (LTAs) divided by the number of hours worked, multiplied by 100,000. A LTA is an accident where an individual is away from work for more than one day and is an auditable indicator across a number of industries. In 2005 the AFR for employees and contractors combined was 0.23. In 2006 there was a very strong improvement to 0.12. International Power intends to consolidate this by establishing a target of 0.12 for 2007. This does not mean we tolerate unsafe behaviour; we seek to have zero LTAs but targets need to be realistic and challenging. The data underlying these calculations is submitted by individual plants directly into the corporate reporting system.
Reportable environmental incidents
The environment and how we care for it is central to the business of International Power and we have always had a policy commitment to comply with all applicable environmental regulations. One measure of our compliance with this policy is compliance with environmental licences for our power plants, issued by the relevant statutory authorities. Environmental licences require that any environmental incident is reported. The underlying data is submitted by individual plants directly into the corporate reporting system. The results of this KPI for 2005 and 2006, and the objective for 2007 are set out below.
Technical availability
Technical availability measures when a plant is available for dispatch. Each of our plants will generally be unavailable during some periods in the year due to a combination of planned outages for maintenance and unplanned outages due to plant breakdowns or operational problems.
An important part of our business is ensuring that our trading and power purchase agreements are closely aligned to our operational activities and availability planning is a key factor in this regard. The yearto- year variance in the profile of planned outages influences both the achieved and targeted availability. Technical availability is calculated by first determining the potential maximum amounts of electricity that could be generated in the year if all the plants were operated at full output for the entire year. We then deduct from this the electricity that could not be produced due to planned and unplanned outages that occurred at the plants throughout the year. This number is then expressed as a percentage of the potential maximum electricity that could be generated, where all these quantities are calculated in terms of electrical energy (GWh). This calculation is carried out using data submitted by the individual plants directly into the corporate reporting system. The results of this KPI for 2005 and 2006, and the objective for 2007 are set out below.
| Key performance indicators | 2005 Result | 2006 Result | 2007 Objectives |
|---|---|---|---|
| Financial KPI's | |||
| Profit from operations* (PFO) | £536 million | £773 million | To increase on prior year |
| Earnings per share* (EPS) | 14.6p | 22.4p | To increase on prior year |
| Free cash flow | £285 million | £456 million | To increase on prior year |
| Non-financial KPIs | |||
| Accident frequency rate (AFR) | 0.23 | 0.12 | 0.12 |
| Reportable environmental incidents | 16 | 16 | 10 |
| Technical availability | 90.1% | 89.6% | 90.0% |
* Excluding exceptional items and specific IAS 39 mark to market movements
Financial highlights
The financial information included in the consolidated financial statements has been prepared on the basis of all applicable IFRSs as adopted by the EU. A discussion of the policies we believe to be most critical in considering the impact of estimates and judgements on the Group's financial position and results of operations.
In order to allow a full understanding of the financial information presented within the consolidated financial statements, and specifically the Group's underlying business performance, the Group presents its income statement such that it separately identifies:
- the results excluding exceptional items and specific IAS 39 mark to market movements;
- the effect of the exceptional items and specific IAS 39 mark to market movements;
- the total result.
The basis of preparation is outlined more fully in note 1 to the consolidated financial statements. However, in summary, those items that the Group separately presents as exceptional are items which, in the judgement of the Directors, need to be disclosed separately by virtue of their size or incidence in order to obtain a proper understanding of the financial information. Those items that the Group separately discloses as specific IAS 39 mark to market movements are those mark to market movements recorded in the income statement which relate to: derivative contracts into which the Group has entered in order to economically hedge certain of its physical and financial exposures; and fair value gains and losses on equity conversion features embedded within convertible bonds, so as to separately identify a non-cash movement which, if the conversion option is exercised, will ultimately be extinguished by the issue of equity.
A summary of the Group's financial performance during the year is as follows:
| Income statement | Year ended 31 December 2006 £m |
Year ended 31 December 2006 £m |
|---|---|---|
| Excluding exceptional items and specific IAS 39 mark to market movements |
||
| Revenue (including joint ventures and associates) | 3,645 | 2,980 |
| Profit from operations | ||
| - from subsidiaries | 565 | 345 |
| - from joint ventures and associates | 208 | 191 |
| Profit from operations | 773 | 536 |
| Interest | 248 | 202 |
| Profit before tax | 525 | 334 |
| Tax | 122 | 68 |
| Profit for the year | 403 | 266 |
| Minority interests | 71 | 52 |
| Profit attributable to equity holders of the parent | 332 | 214 |
| Earnings per share (basic) | 22.4p | 14.6p |
| Including exceptional items and specific IAS 39 mark to market movements |
||
| Profit from operations | 898 | 611 |
| Profit for the year | 477 | 330 |
| Profit attributable to equity holders of the parent | 410 | 285 |
| Earnings per share (basic) | 27.6p | 19.4p |
| Cash flow | Year ended 31 December 2006 £m |
Year ended 31 December 2006 £m |
|---|---|---|
| Profit for the year | 477 | 330 |
| Depreciation, amortisation and other movements(1) | 322 | 183 |
| Dividends received from joint ventures and associates |
113 | 92 |
| Capital expenditure – maintenance | (128) | (72) |
| Movements in working capital | (15) | (21) |
| Net tax and interest paid | (313) | (227) |
| Free cash flow | 456 | 285 |
(1) Depreciation, amortisation and other movements include income statement charges for interest, tax, depreciation, the share of profit of joint ventures and associates, the exceptional profit on the TXU settlement, and the exceptional profit on compensation for breach of contract.
| Balance sheet | As at 31 December 2006 £m |
As at 31 December 2006 £m |
|---|---|---|
| Net assets | 2,740 | 2,375 |
| Net debt | (3,485) | (2,979) |
| Gearing | 127% | 125% |
| Debt capitalisation | 56% | 56% |
Profit from operations (PFO)
2006 PFO (excluding exceptional items and specific IAS 39 mark to market movements) at £773 million is 44% ahead of 2005. This principally reflects improved spreads and load factors in New England and Texas, strong contributions from First Hydro, Rugeley, Saltend and our Czech businesses, and first time contributions from assets in the Middle East. PFO (excluding exceptional items and specific IAS 39 mark to market movements) is discussed in more detail in the Regional review sections which follow.
Year ended |
Year ended 31 December 2006 £m |
|
|---|---|---|
| Reconciliation from PFO to PFO (excluding exceptional items and specific IAS 39 mark to market movements) |
||
| Profit from operations | 898 | 611 |
| Deduct exceptional items (profits) | (55) | (110) |
| (Deduct gains)/add losses on specific IAS 39 mark to market movements | (70) | 35 |
| PFO (excluding exceptional items and specific IAS 39 mark to market movements) |
773 | 536 |
| Segmental results | ||||||
|---|---|---|---|---|---|---|
| Subsidiaries | Share of joint ventures and associates |
Total | Subsidiaries | Share of joint ventures and associates |
Total | |
| Year ended 31 December 2006 £m |
Year ended 31 December 2006 £m |
Year ended 31 December 2006 £m |
Year ended 31 December 2005 £m |
Year ended 31 December 2005 £m |
Year ended 31 December 2005 £m |
|
| Profit from operations (excluding exceptional items and specific IAS 39 mark to market movements) |
||||||
| North America | 73 | 28 | 101 | 21 | 27 | 48 |
| Europe | 381 | 69 | 450 | 229 | 54 | 283 |
| Middle East | 32 | 20 | 52 | 12 | 12 | 24 |
| Australia | 121 | 3 | 124 | 136 | 4 | 140 |
| Asia | 3 | 88 | 91 | 6 | 94 | 100 |
| 610 | 208 | 818 | 404 | 191 | 595 | |
| Corporate costs | (45) | - | (45) | (59) | - | (59) |
| 565 | 208 | 773 | 345 | 191 | 536 | |
| Exceptional items and specific IAS 39 mark to market movements | 119 | 6 | 125 | 68 | 7 | 75 |
| Profit from operations | 684 | 214 | 898 | 413 | 198 | 611 |
Earnings per share (EPS)
2006 EPS (excluding exceptional items and specific IAS 39 mark to market movements) at 22.4p is 53% ahead of 2005. This increase principally reflects those items discussed under the heading 'profit from operations' and also reflects an increase in interest and tax expense.
| Year ended 31 December 2006 £m |
Year ended 31 December 2005 £m |
|
|---|---|---|
| Reconciliation from EPS to EPS (excluding exceptional items and specific IAS 39 mark to market movements) | ||
| EPS | 27.6p | 19.4p |
| Deduct after tax and minority interest profit impact of exceptional items |
(2.7)p | (5.8)p |
| (Deduct)/add back after tax and minority interest (profit)/loss impact of specific IAS 39 mark to market movements |
(2.5)p | 1.0p |
| EPS (excluding exceptional items and specific IAS 39 mark to market movements) |
22.4p | 14.6p |
Free cash flow
Free cash flow in 2006 at £456 million is 60% ahead of 2005. This increase was driven by strong operational and financial performance across the Group together with higher dividends from joint ventures and associates. This was partially offset by increased tax and interest payments (£86 million higher) and an increase in maintenance capital expenditure of £56 million.
| Year ended 31 December 2006 £m |
Year ended 31 December 2005 £m |
|
|---|---|---|
| Reconciliation from net cash inflow from operating activities to free cash flow | ||
| Net cash inflow from operating activities | 475 | 338 |
| Add back exceptional finance costs | - | 5 |
| Less exceptional receipt from TXU Administrators | (14) | (58) |
| Less exceptional receipt of compensation for breach of contract |
(5) | - |
| Free cash flow | 456 | 285 |
Dividend
The Board is proposing a dividend of 7.9p per share (2005: 4.5p), an increase of 75% year-on-year and representing a pay-out ratio of 35% of EPS (excluding exceptional items and specific IAS 39 mark to market movements). This increase is in line with the Group's policy of progressively moving towards a dividend pay-out ratio of 40%.
Payment of this dividend to shareholders registered on the Company share register on 25 May 2007 is due to be made on 26 June 2007, following approval at the 2007 AGM, which will be held on 15 May 2007.
Outlook
Our broadly based international portfolio has been strengthened by the successful integration of acquired assets and the addition of new greenfield projects commissioned in 2006, and provides a solid platform for our business. This, coupled with a largely forward contracted position for our merchant market capacity, gives us confidence that 2007 will be a year of further growth.
- Financial KPIs
- Profit from operations*
- Earnings per share*
- Free cash flow
- Non-financial KPIs
- Accident frequency rate
- Reportable environmental incidents
- Technical availability


