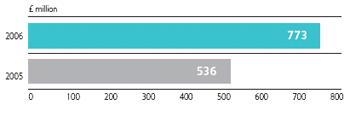
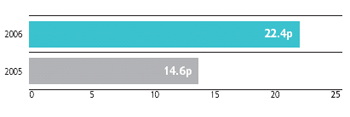
In 2006 our profit from operations* increased significantly from £536 million in 2005 to £773 million and earnings per share* increased from 14.6p to 22.4p, an improvement of 53%.
| Year ended 31 December 2006 £m |
Year ended 31 December 2005 £m |
|
|---|---|---|
| Excluding exceptional items and specific IAS 39 mark to market movements |
||
| Revenue (including joint ventures and associates) |
3,645 | 2,980 |
| Profit from operations | 773 | 536 |
| Profit before tax | 525 | 334 |
| Earnings per share in pence (basic) | 22.4p | 14.6p |
| Including exceptional items and specific IAS 39 mark to market movements |
||
| Revenue (including joint ventures and associates) |
3,783 | 2,936 |
| Profit from operations | 898 | 611 |
| Profit before tax | 624 | 419 |
| Earnings per share in pence (basic) | 27.6p | 19.4 |
| Dividend per share in pence | 7.9p | 4.5p |
| Cash generated from operations | 769 | 512 |
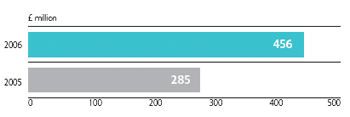
| Free cash flow - Group cash flow table | 456 | 285 |
| Capital expenditure | ||
| Maintenance | 128 | 72 |
| Growth | 142 | 188 |
| Major acquisition expenditure | ||
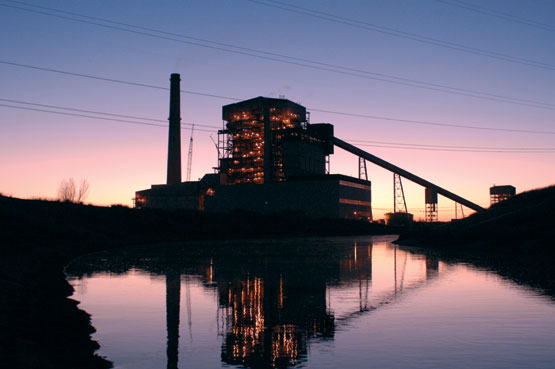
| Coleto Creek | 621 | - |
| Levanto | 129 | - |
| Saltend | - | 495 |
| As at 31 December 2006 £m |
As at 31 December 2005 £m |
|
|---|---|---|
| Net assets | 2,740 | 2,375 |
| Net debt | (3,485) | (2,979) |
| Gearing | 127% | 125% |
| Debt capitalisation | 56% | 56% |
Profit from operations*

Earnings per share* (basic)

Free cash flow

*Excluding exceptional items and specific IAS 39 mark to market movements

